


Diastasis Rehab Statistics
Diastasis Distance

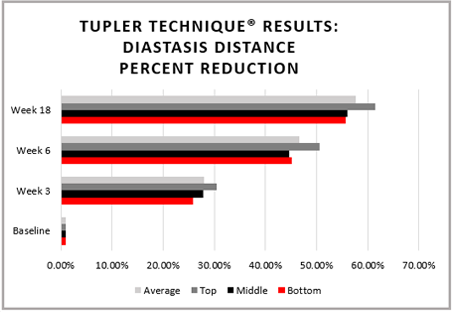
- Results represent average reduction of 372 individuals across six subgroups (vaginal birth, C-section, vaginal and C-Section births, pregnant, not pregnant, and men) and three sub-locations of the diastasis (top, middle, and bottom) measured between 2009 and 2016.
- P-value < .0001 for difference in paired means between Week 1 and Week 18.
- For a more detailed breakdown, please visit Diastasis Distance Results.
Diastasis Distance

- Results represent average reduction of 372 individuals across six subgroups (vaginal birth, C-section, vaginal and C-Section births, pregnant, not pregnant, and men) and three sub-locations of the diastasis (top, middle, and bottom) measured between 2009 and 2016.
- P-value < .0001 for difference in paired means between Week 1 and Week 18.
- For a more detailed breakdown, please visit Diastasis Distance Results.
Summary

Body Circumference

- Results represent average percentage reduction of 372 individuals across six subgroups (vaginal birth, C-section, vaginal and C-Section births, pregnant, not pregnant, and men) and three sub-locations of the diastasis (top, middle, and bottom) measured between 2009 and 2016.
- P-value < .0001 for difference in paired means between Week 1 and Week 18.
- For a more detailed breakdown, please visit Body Circumference Results
Summary

Connective Tissue Depth

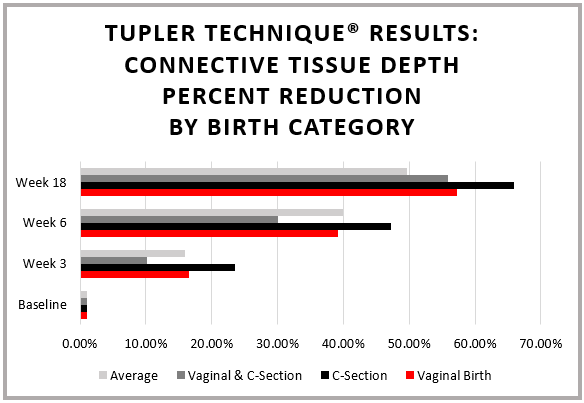
- Results represent average percentage reduction of 372 individuals across six subgroups (vaginal birth, C-section, vaginal and C-Section births, pregnant, not pregnant, and men) and three sub-locations of the diastasis (top, middle, and bottom) measured between 2009 and 2016.
- P-value < .0001 for difference in paired means between Week 1 and Week 18.
- For a more detailed breakdown, please visit Connective Tissue Depth Results.
Summary

Connective Tissue Depth

- Results represent average percentage reduction of 372 individuals across six subgroups (vaginal birth, C-section, vaginal and C-Section births, pregnant, not pregnant, and men) and three sub-locations of the diastasis (top, middle, and bottom) measured between 2009 and 2016.
- P-value < .0001 for difference in paired means between Week 1 and Week 18.
- For a more detailed breakdown, please visit Connective Tissue Depth Results.

Diastasis Distance Tupler Technique® Program Results, 2009-2016
Diastasis Distance

Summary

Diastasis Distance

Summary

Diastasis Distance

Summary

Additional Statistics Details:
BODY CIRCUMFERENCE: Tupler Technique® Program Results, 2009-2016
Statistical Outcomes and Insights: Tupler Technique® Program Results, 2009-2016
Tupler Technique® Program Results: Frequently Asked Questions (FAQ)
Statistics Summary
Body Circumference: Tupler Technique® Program Results, 2009-2016
Body Circumference

Summary

Body Circumference

Summary

Body Circumference

Summary

Additional Statistics Details:
BODY CIRCUMFERENCE: Tupler Technique® Program Results, 2009-2016
Statistical Outcomes and Insights: Tupler Technique® Program Results, 2009-2016
Tupler Technique® Program Results: Frequently Asked Questions (FAQ)
Statistics Summary
Diastasis Depth: Percentage of Clients with Shallow Depth (0-3cm) Tupler Technique® Program Results, 2009-2016
Connective Tissue Depth

Summary

Connective Tissue Depth

Summary
Connective Tissue Depth

Summary

Additional Statistics Details:
BODY CIRCUMFERENCE: Tupler Technique® Program Results, 2009-2016
Statistical Outcomes and Insights: Tupler Technique® Program Results, 2009-2016
Tupler Technique® Program Results: Frequently Asked Questions (FAQ)
Statistics Summary
Statistical Methodology, Outcomes and Insights: Tupler Technique® Program Results (2009-2016)
Data Collection
- Diastasis Rehab statistics were derived from the results of 372 Tupler Technique® clients who participated in the program between 2009 and 2016. All clients were trained by Tupler Technique® Professionals. The diastasis distance, body circumference, and connective tissue depth of each client was measured in-person four times throughout the program – at weeks one, three, six, and eighteen – in order to quantitatively track and assess the program’s impact.
- 2,999 observations were recorded for diastasis distance, 4,447 observations for connective tissue depth, and 2,316 for body circumference, for a total of 9,762 client observations throughout the program’s duration. These 9,762 measurements served as the foundation of the following statistical analysis.
Client Population
- 305 clients out of the 372 total had given birth. In other words, 90.54% of clients were mothers. The majority of mothers had either given birth either via C-Section (42.74%) or vaginally (38.98%). A small proportion of the population had given birth both vaginally and C-Section (10.01%).
- The 9.46% of clients who had not given birth were either men, women who had not been pregnant, or women who were currently pregnant.
Program Results
- Of the three observed measurements – diastasis distance, body circumference, and connective tissue depth – clients across all demographics experienced the most dramatic improvements in diastasis distance and connective tissue depth. Throughout the course of the program, clients reduced the distance of their diastasis by 55-60% and decreased the depth of their diastasis by 50-65%.
- Among diastasis locations – top, middle, and bottom – the results differed depending on what was measured. For diastasis distance, clients’ top sections generally experienced the greatest reduction. For body circumference, clients’ middle and bottom sections decreased by the largest amount. Finally, clients decreased their connective tissue depth by the most on bottom.
- While all clients benefited substantially from the program, results from mothers who had given birth via C-Section were particularly striking. Mothers with C-Sections, on average, reduced their diastasis distance by 60.87%, their body circumference by 9.64% and their connective tissue depth by 55.425%. Results for mothers who had given birth vaginally were also significantly above average, especially for body circumference (13.44% average decrease) and connective tissue depth (62.75% reduction).
Additional Statistics Details:
DIASTASIS DISTANCE: Tupler Technique® Program Results, 2009-2016
BELLY CIRCUMFERENCE: Tupler Technique® Program Results, 2009-2016
Statistical Outcomes and Insights: Tupler Technique® Program Results, 2009-2016
Tupler Technique® Program Results: Frequently Asked Questions (FAQ)
Statistics Summary
Tupler Technique® Program Results: Frequently Asked Questions (FAQ)
Q: How was diastasis distance measured?
A: Diastasis distance was measured by the number of fingers that Tupler Technique® Professionals could spread horizontally across the patient’s diastasis. To approximate finger width, this number was multiplied by 1.8, the mean adult finger width observed in centimeters in the following studies:
- Johnson, Peter, and Sharon Blackstone. "Children and Gender—differences in Exposure and How Anthropometric Differences Can Be Incorporated into the Design of Computer Input Devices." Scandinavian Journal of Work and Health 3 (2007): 26-32.
- Dandekar, Kiran, Balasundar Raju and Mandayam Srinivasan. “3-D Finite Element Models of Human and Monkey Fingertips to Investigate the Mechanics of Tactile Sense.” Journal of Biomechanical Engineering125.5 (2003): 682-91.
- Chandra, Arunesh, Pankaj Chandna, and Surinder Deswal. “Analysis of Hand Anthropometric Dimensions of Male Industrial Workers of Haryana State.” International Journal of Engineering 29.2 (2011): 163-182.
Q: What does “connective tissue depth” mean?
A: “Connective tissue depth” refers to the depth of the diastasis. Throughout the program, the depth was measured and recorded as Shallow (corresponding to 0-3 cm), Medium (corresponding to 3-6 cm), or Deep (corresponding to 6-7 cm). Shallow is the most desirable measurement, as it means either that clients’ connective tissue has properly healed or that the existing depth of the diastasis is very minor. At each stage, the statistical analysis calculated the frequency of clients who had the ideal outcome, e.g., a “shallow” depth. By Week 18, 69.61% of clients had achieved this designation.
Q: What kind of statistical tests were used to arrive at the P-values?
A: A paired t-test was used in order to analyze the diastasis distance and body circumference. The paired t-test was ideal for this analysis because the sample met all of the test’s parameters and because the data contained “before” and “after” results for each client. This allowed only clients who had both “before” and “after” measurements to be compared and analyzed, with each client effectively serving as his or her own control. By reducing the inevitable variability between clients, the paired t-test served as the most accurate and appropriate statistical method available for this sample.
McNemar’s test was used to analyze the significance of connective tissue depth. Measurements for a client’s connective tissue depth represented categorical – as opposed to numerical – data. Unlike diastasis distance or body circumference, connective tissue depth was categorized as either shallow, medium, or deep, with quantitative ranges corresponding to each of those categories. Therefore, the paired t-test could not be used. However, McNemar’s test is conducted specifically for paired categorical data and was the ideal test in this case.
Q: What is a P-value and what do the P-values for your results indicate?
A: A P-value is the probability of getting our results purely by chance - that is, if the Tupler Technique® exerted zero influence on the data. The smaller the P-value, the greater the evidence that the Tupler Technique® strongly influenced clients’ final measurements. Generally, results are considered “significant” if P > .01. In this analysis, for each diastasis measurement (diastasis distance, body circumference, and connective tissue depth), P-values were substantially less than .01. These p-values serve as robust evidence to support the hypothesis that the Tupler Technique® program significantly impacted clients’ reductions in their diastasis.